LiveRamp Data Collaboration and AdTech

Graph Monitoring and Visibility
Research and Ideation
Design
Results, Feedback, Retrospective
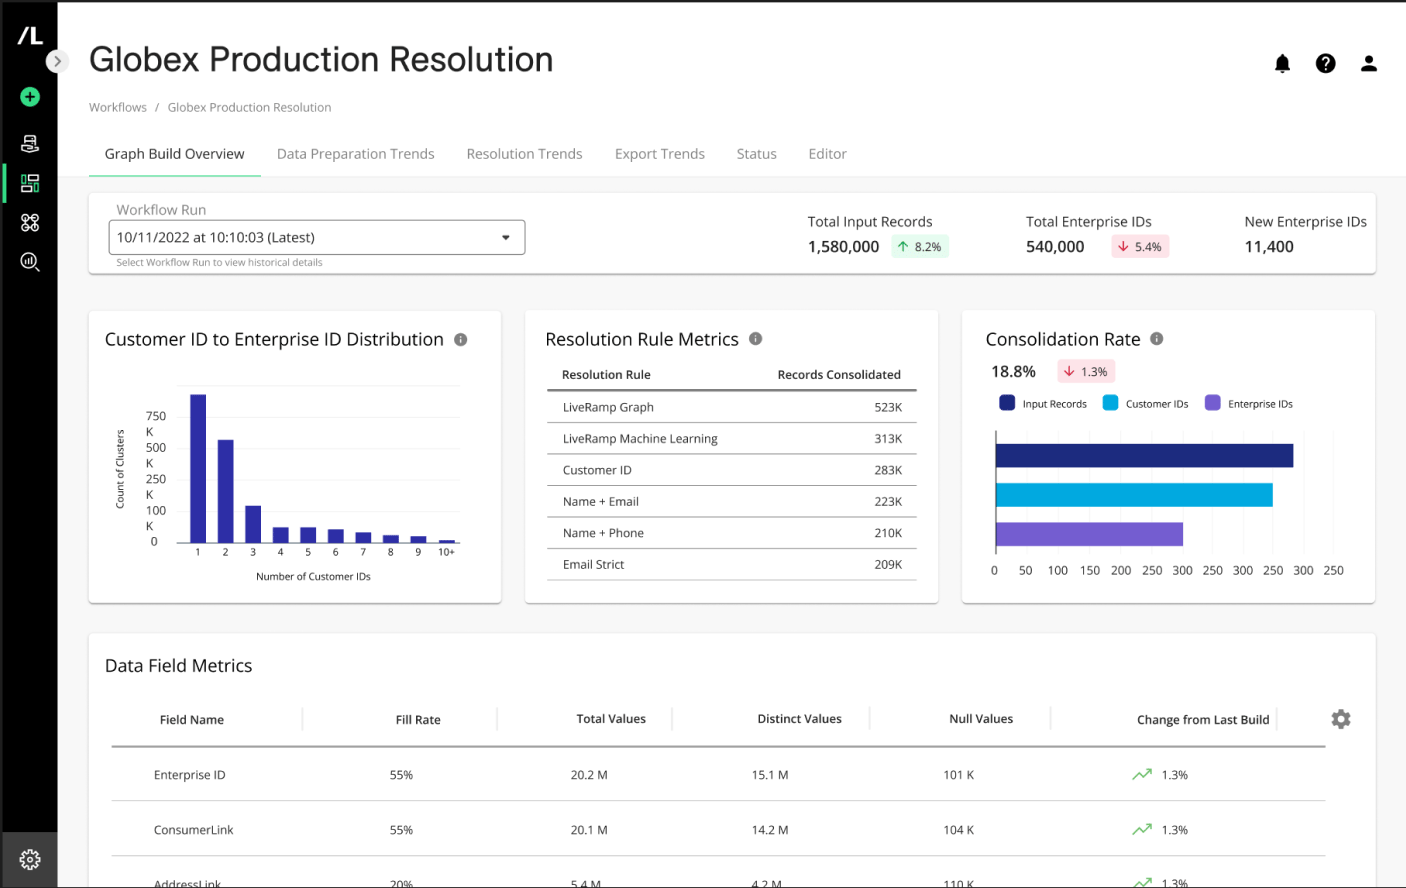


Identity Engine - Graph Metric Dashboards
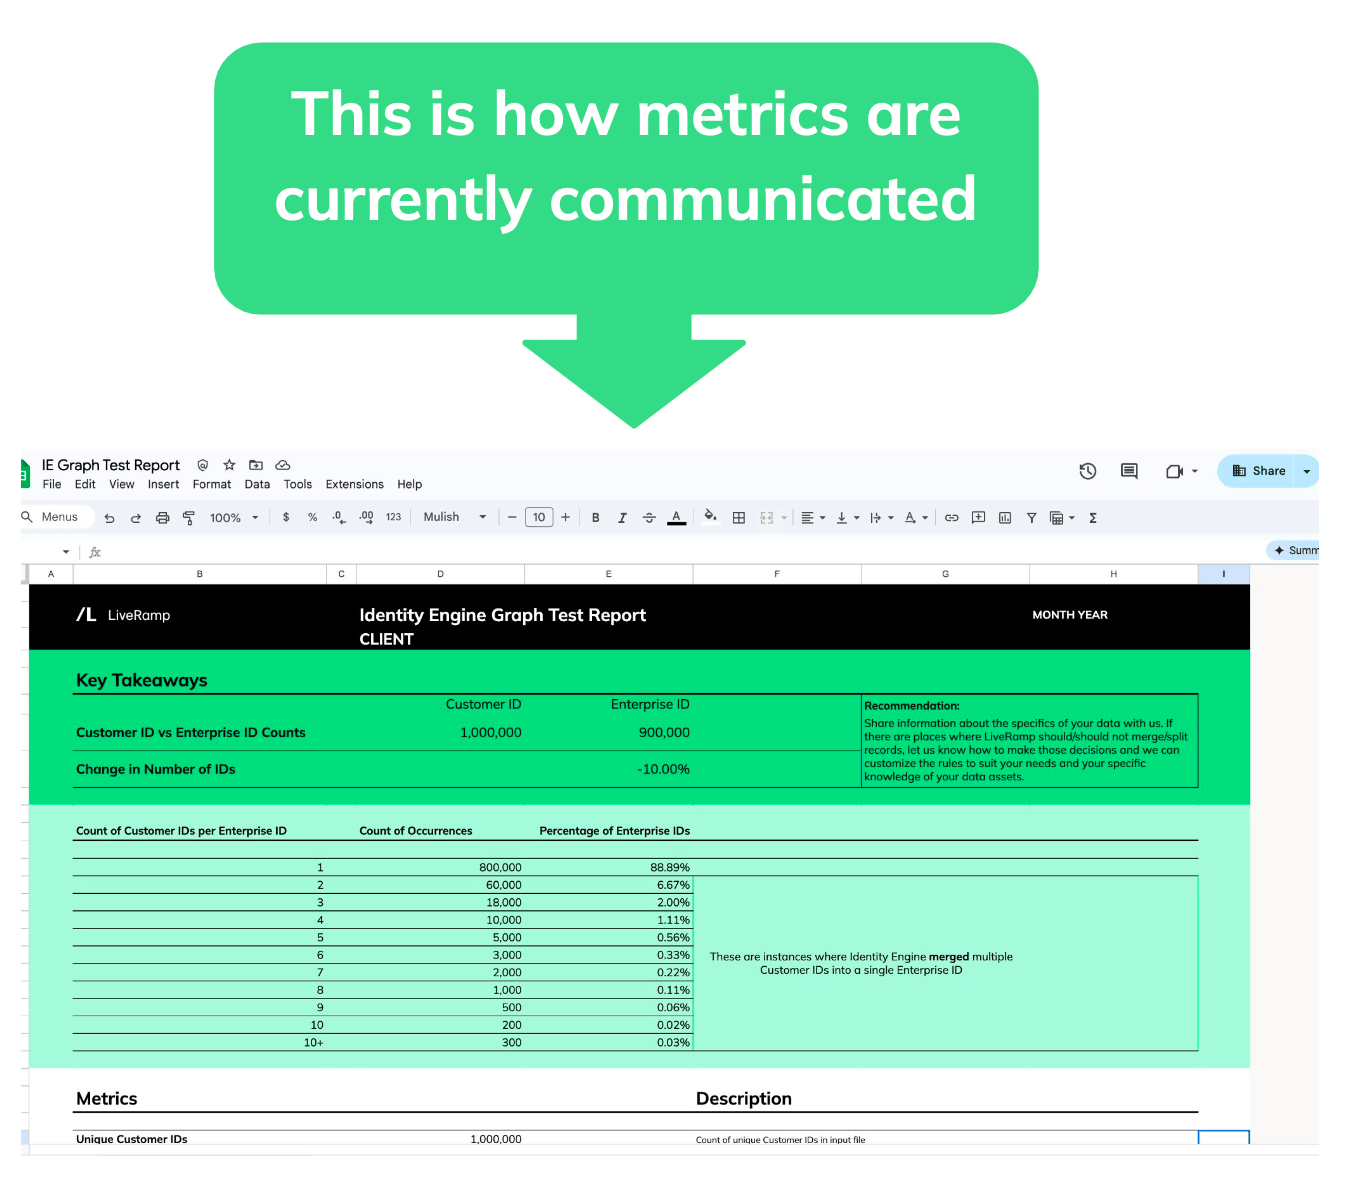
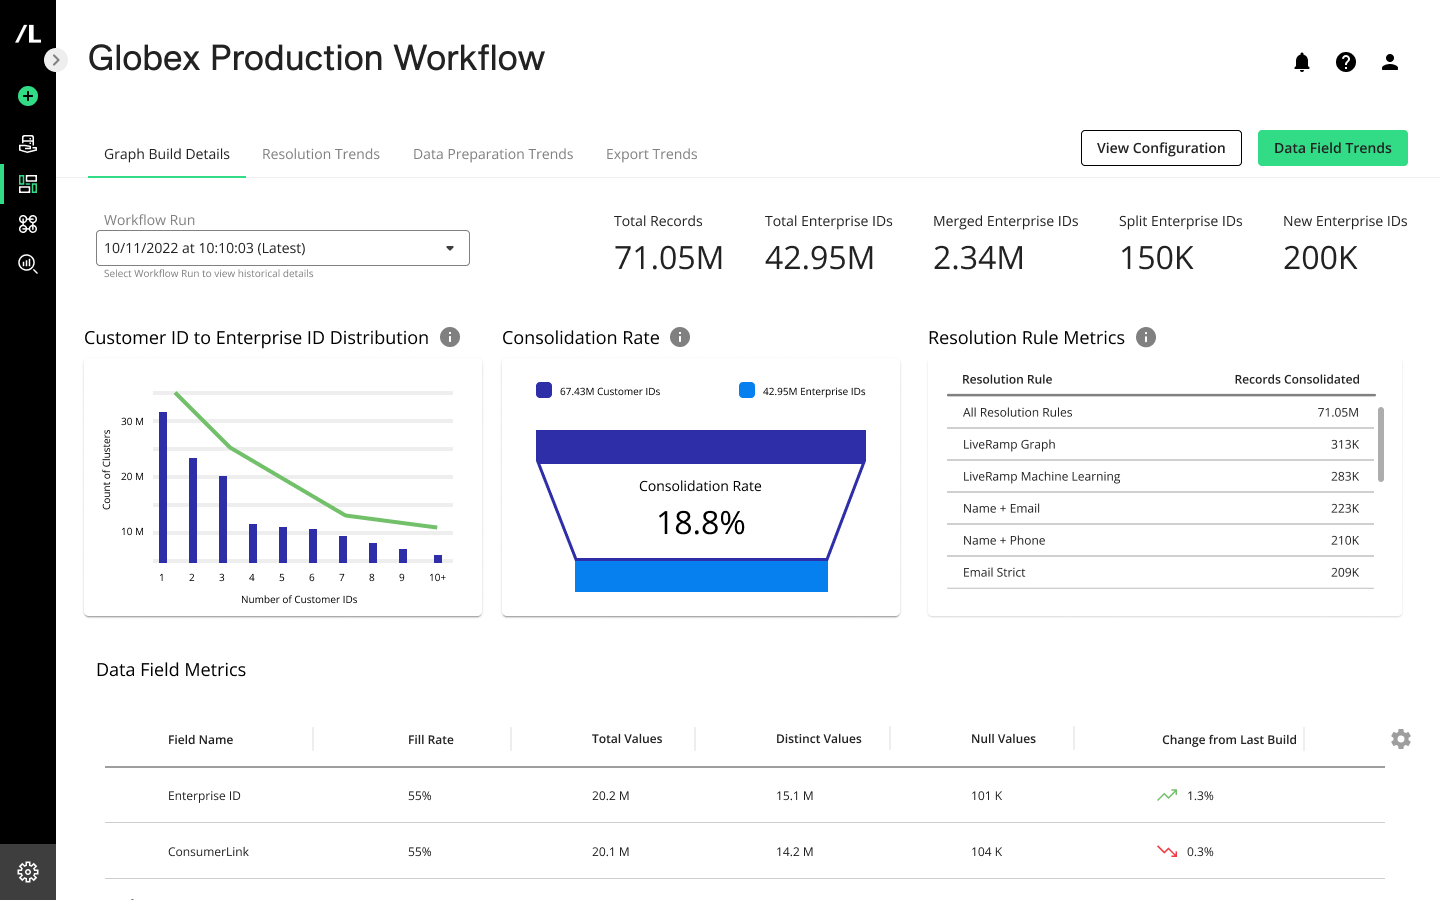
Previously, metrics were delivered to customers in Google Sheets and manual data analysis was required.
Enable customers to:
- Optimize data quality gates
- Understand and update resolution rules based on performance
- Balance graph stability with iterative improvement on consolidation
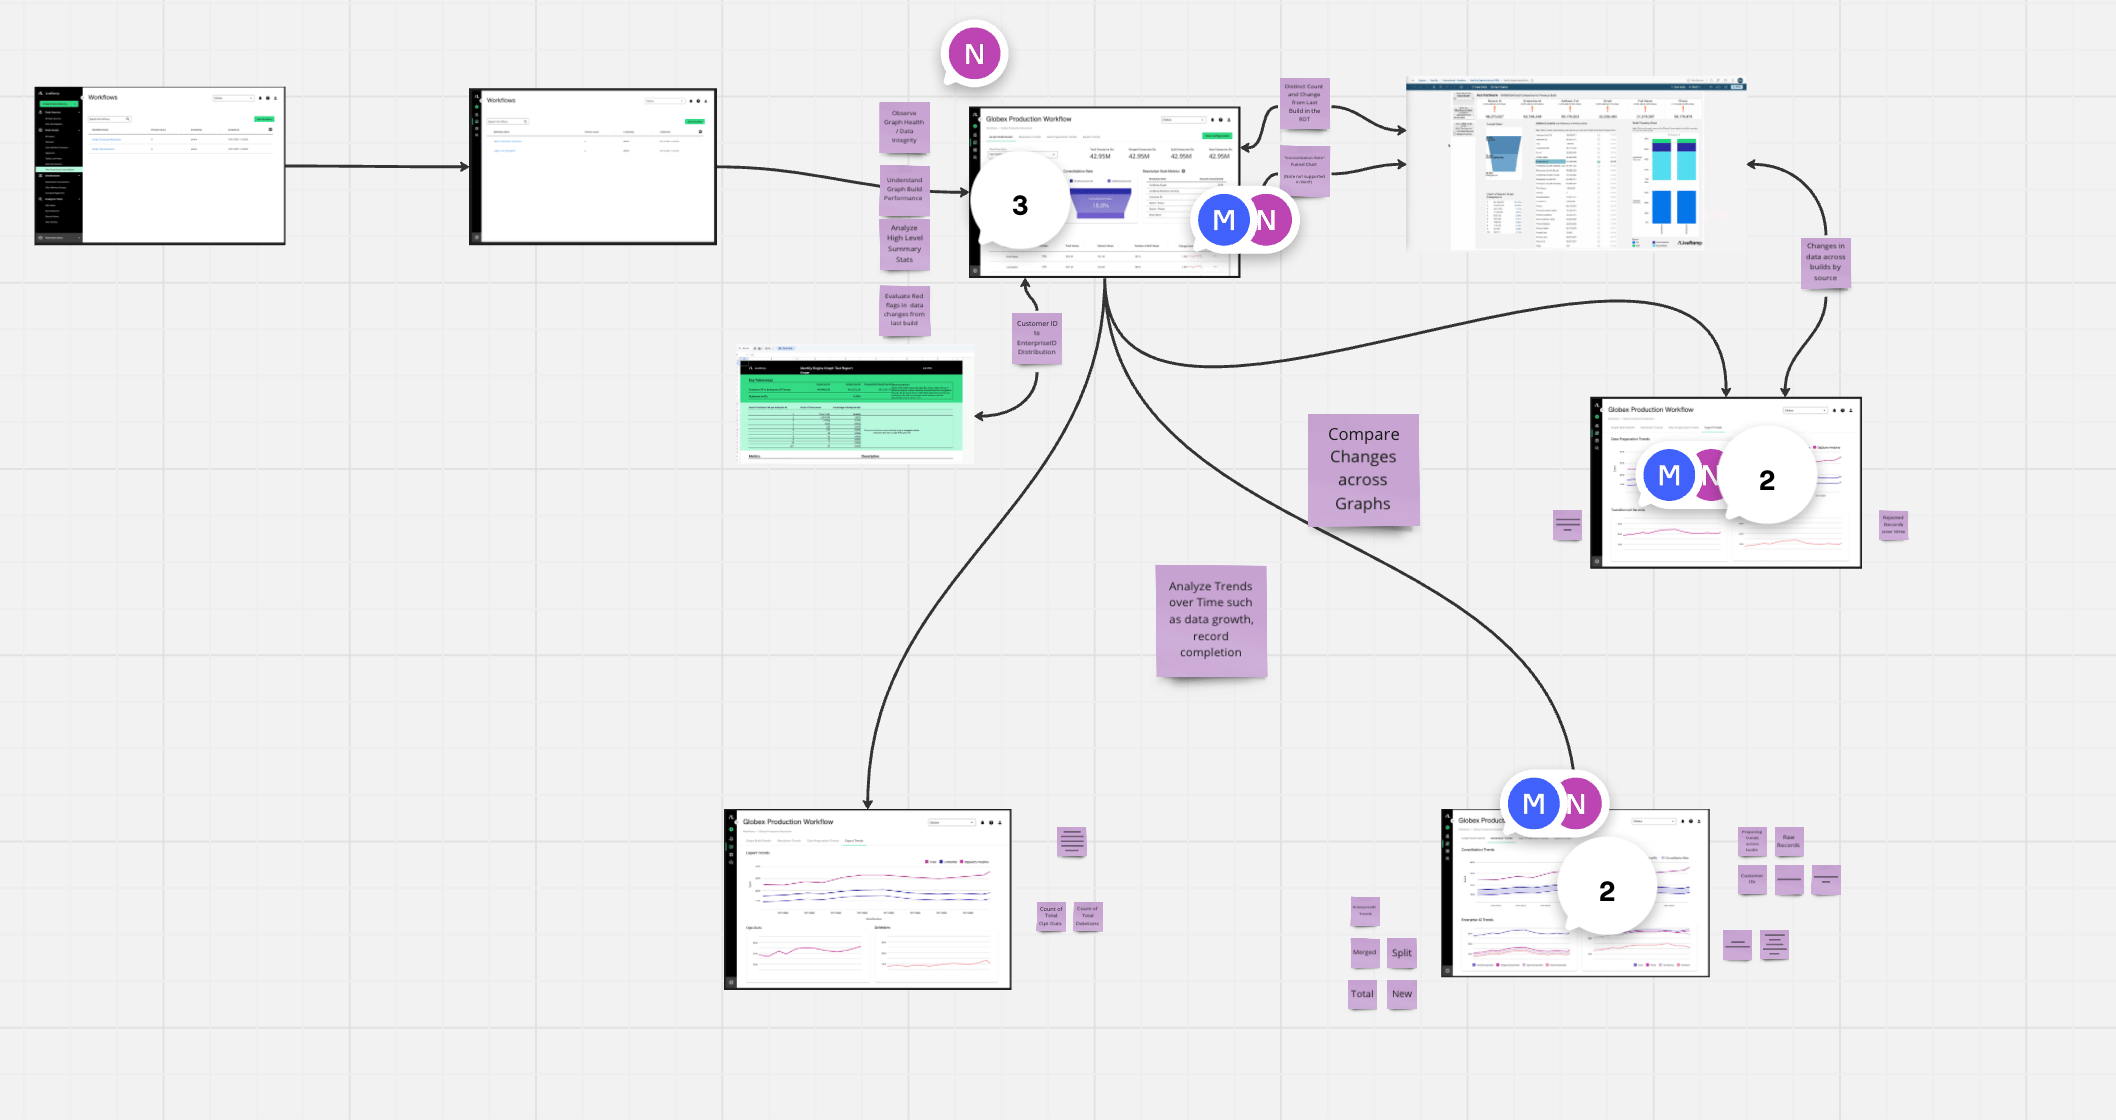
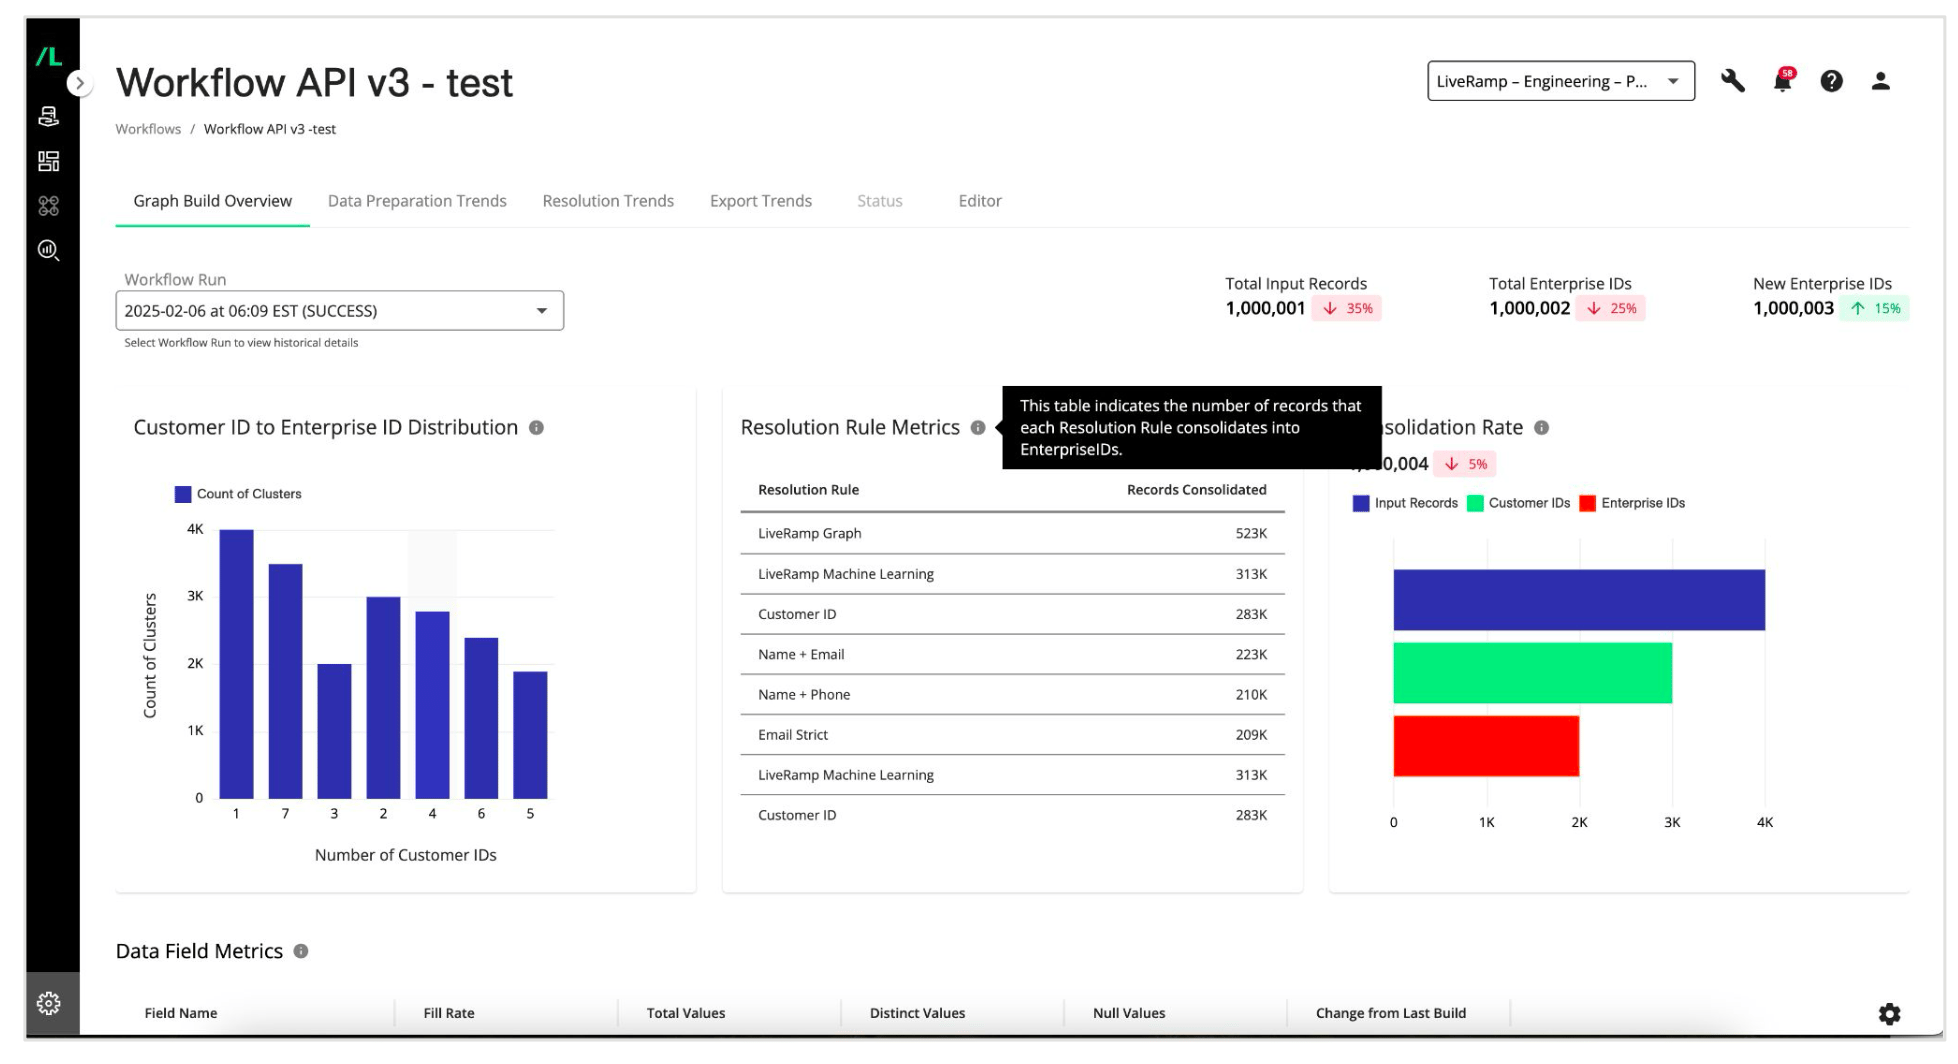
Users want to understand how changes impact the outcome of a graph build.
They want actionable insights.
NNG Usability Heuristic 1 : Visibility of System Status
October 2024 -February 2025
Summary
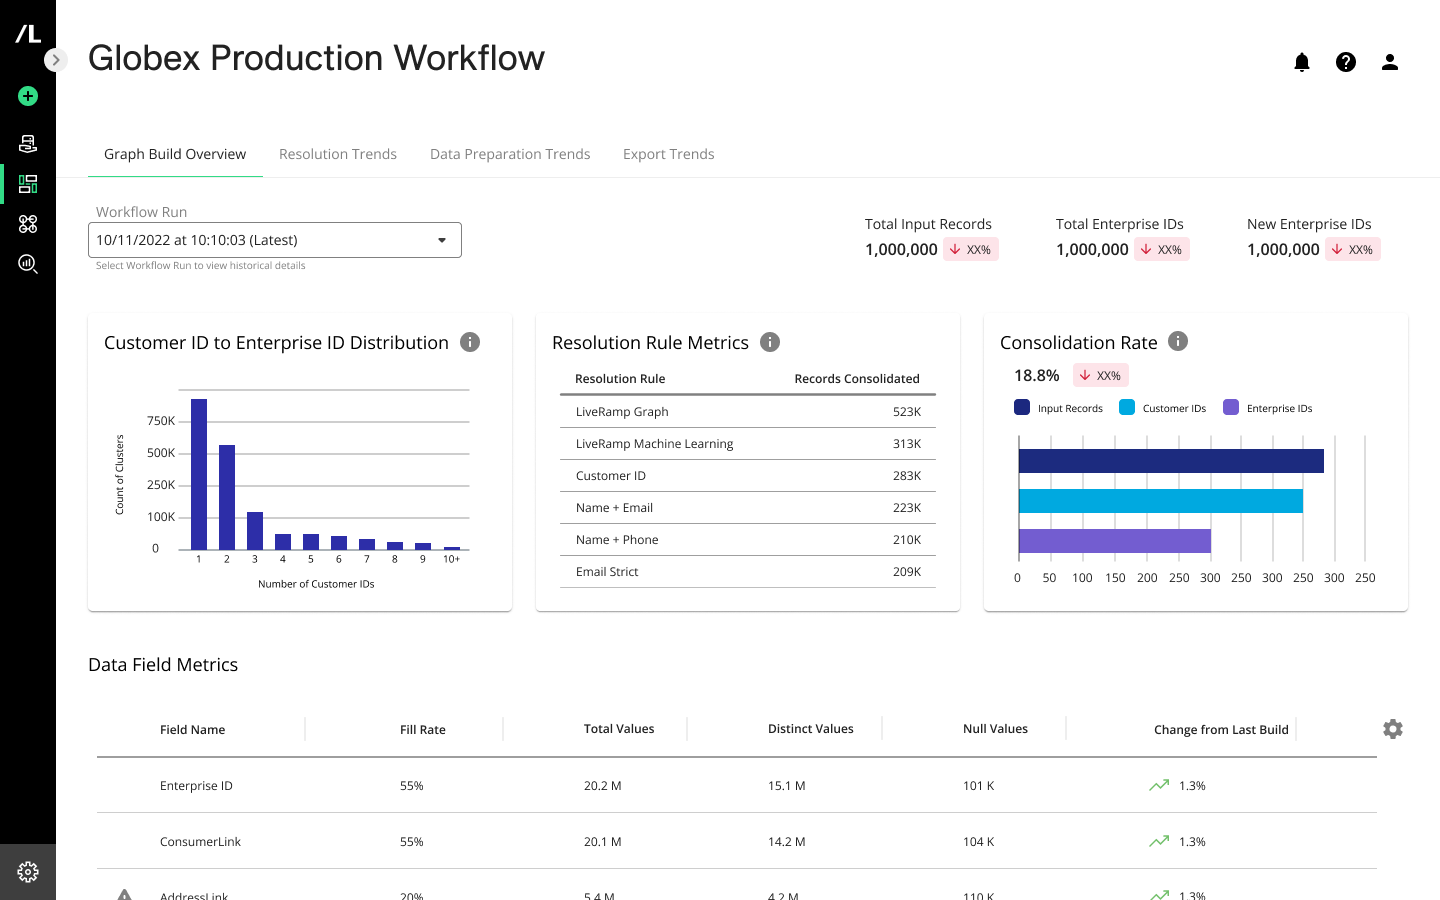
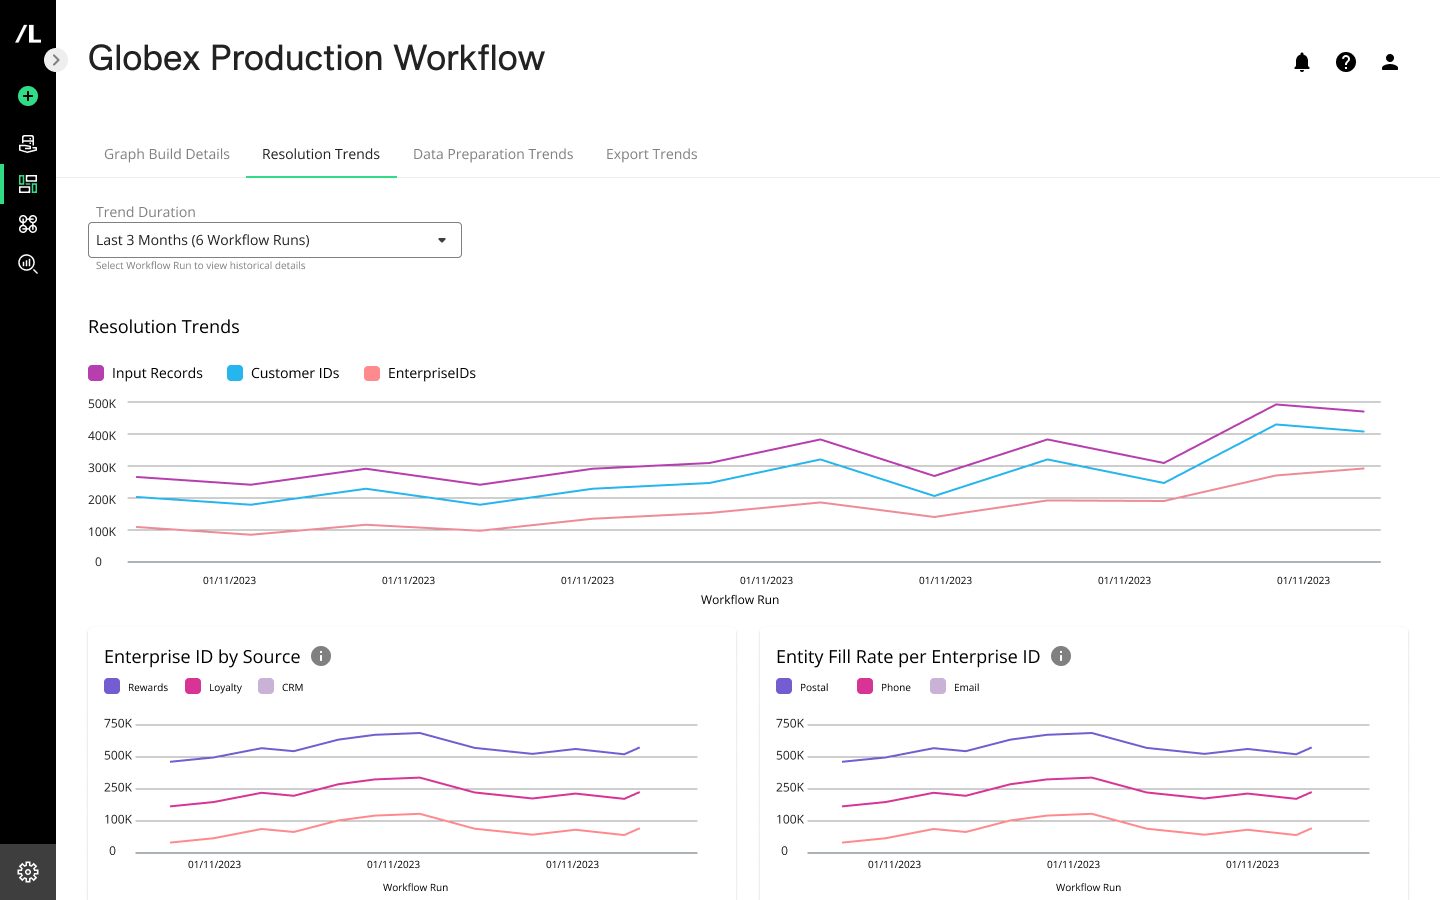
A set of four dashboards with data visualizations to enable users to monitor individual graph builds and compare results across time.
I was the lead designer working with four development teams and three product managers.
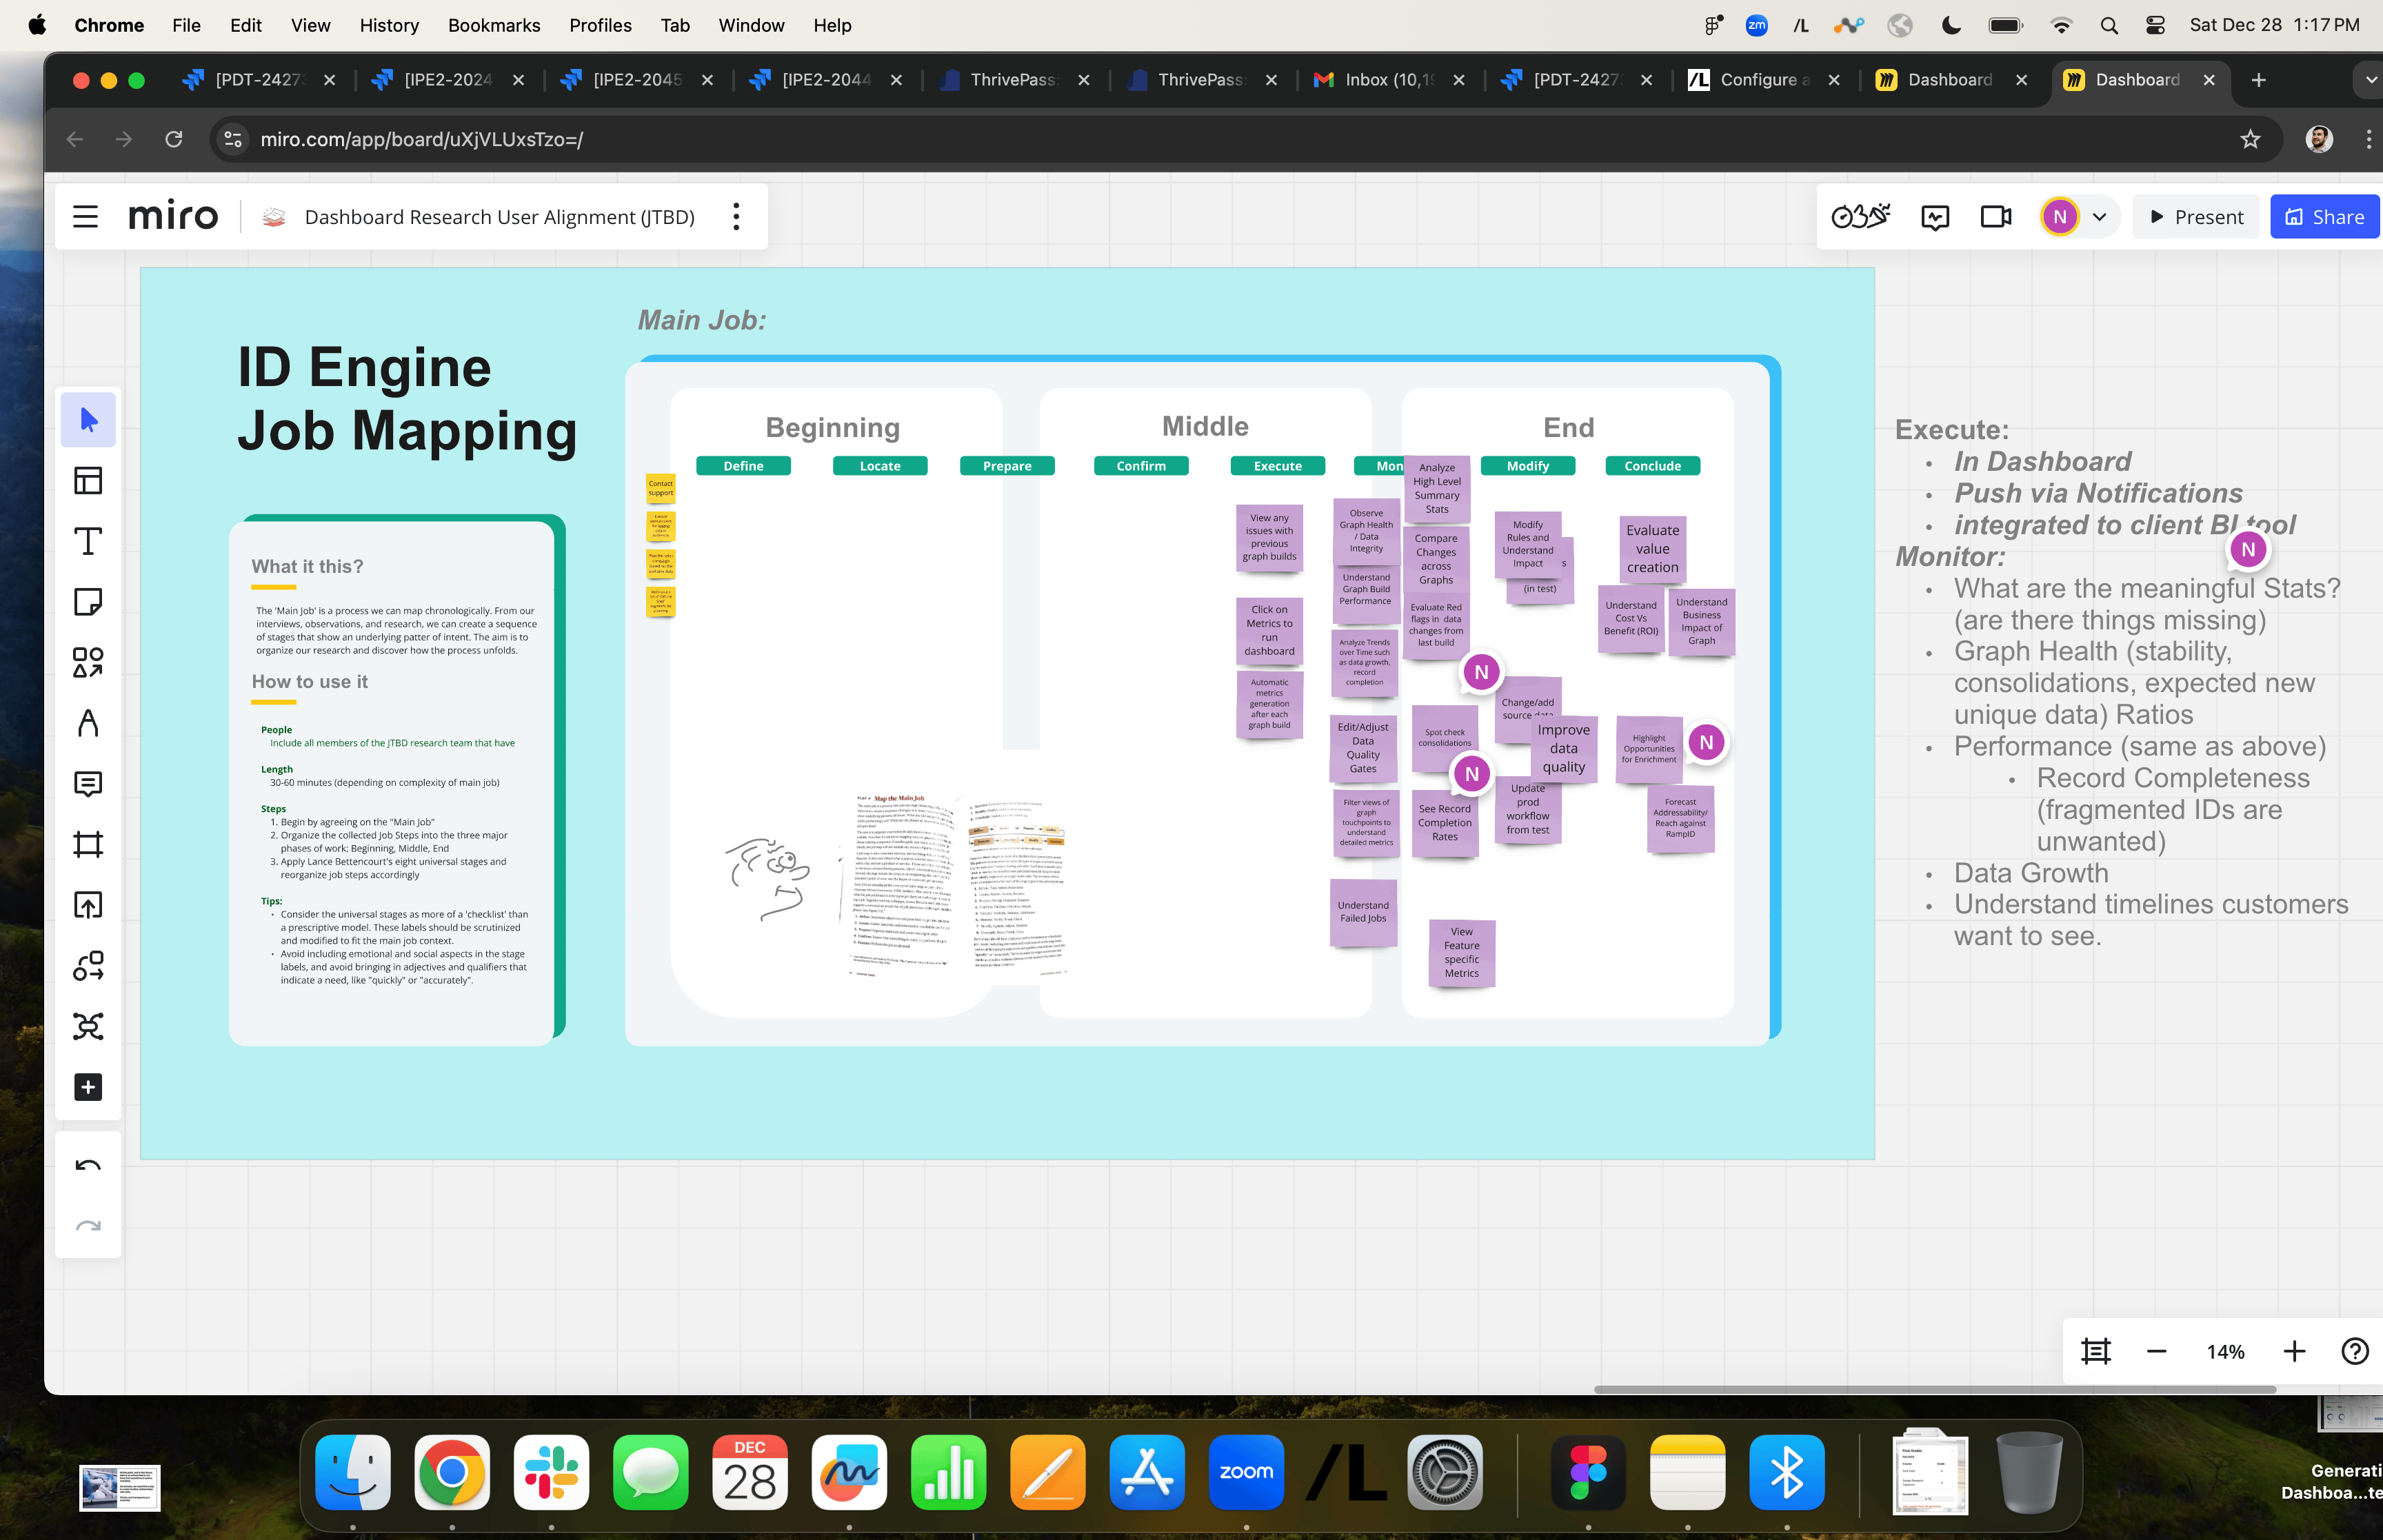
Jobs To Be Done Workshop

Product Requirements
Problem Statement
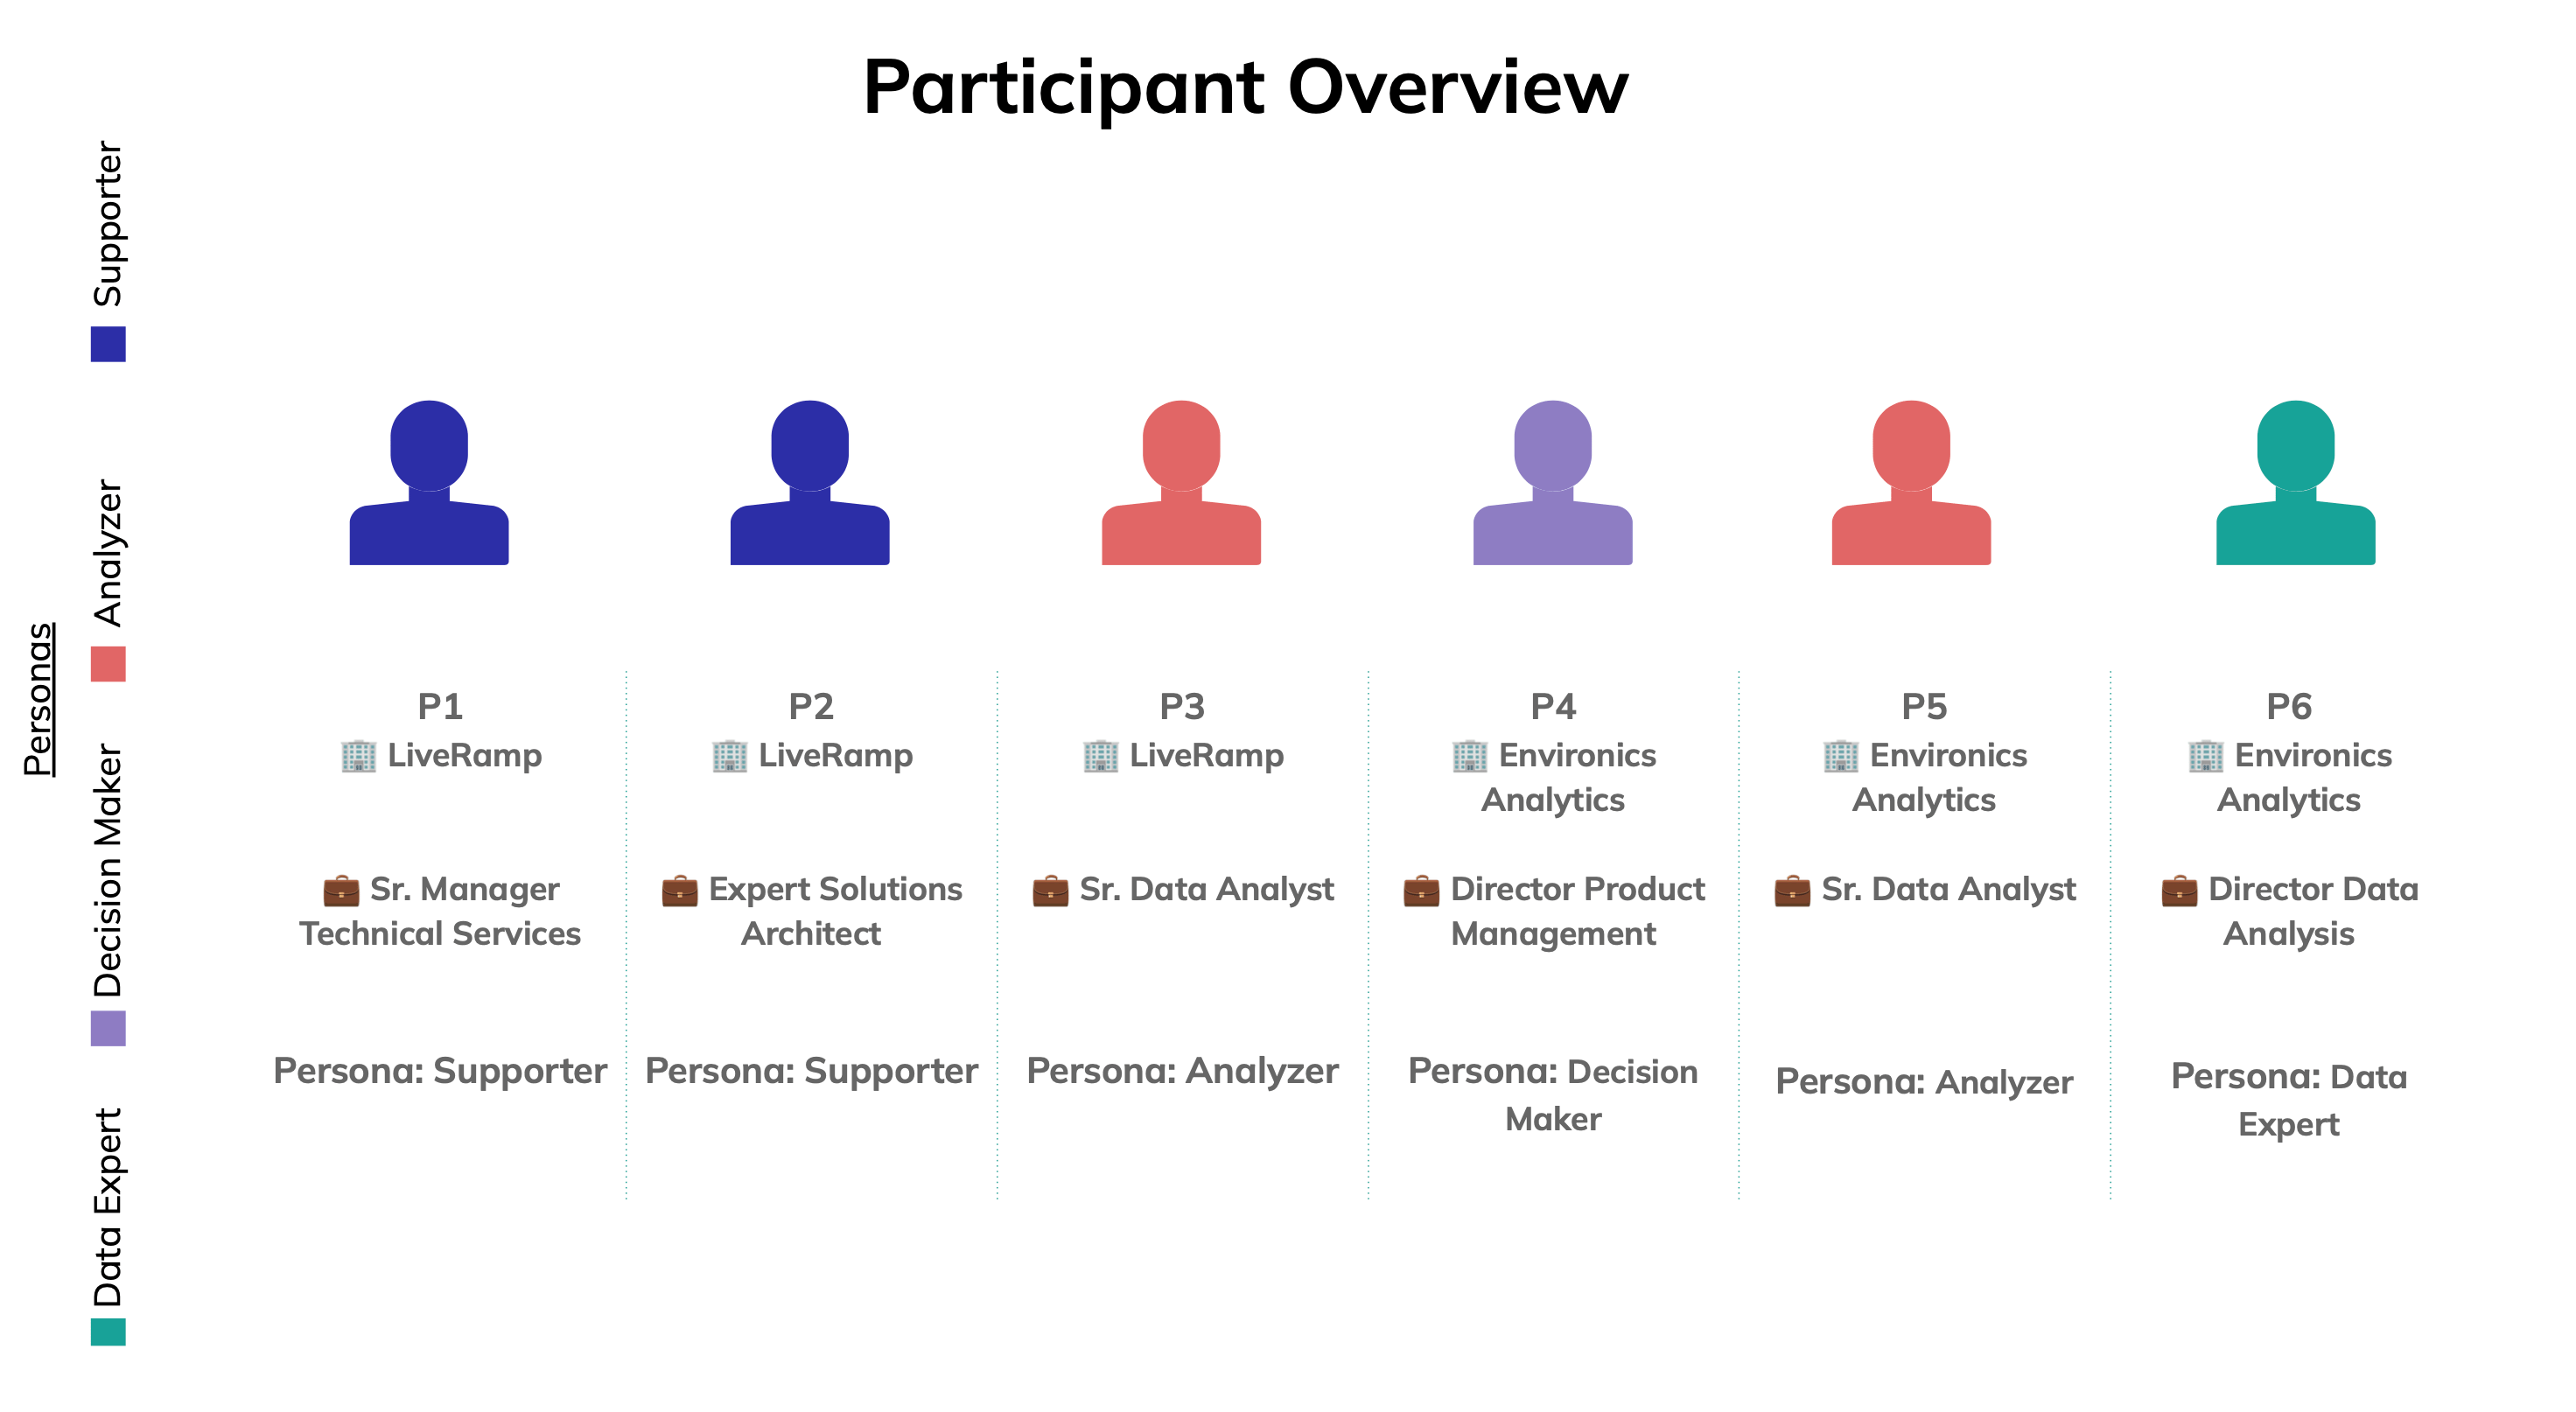
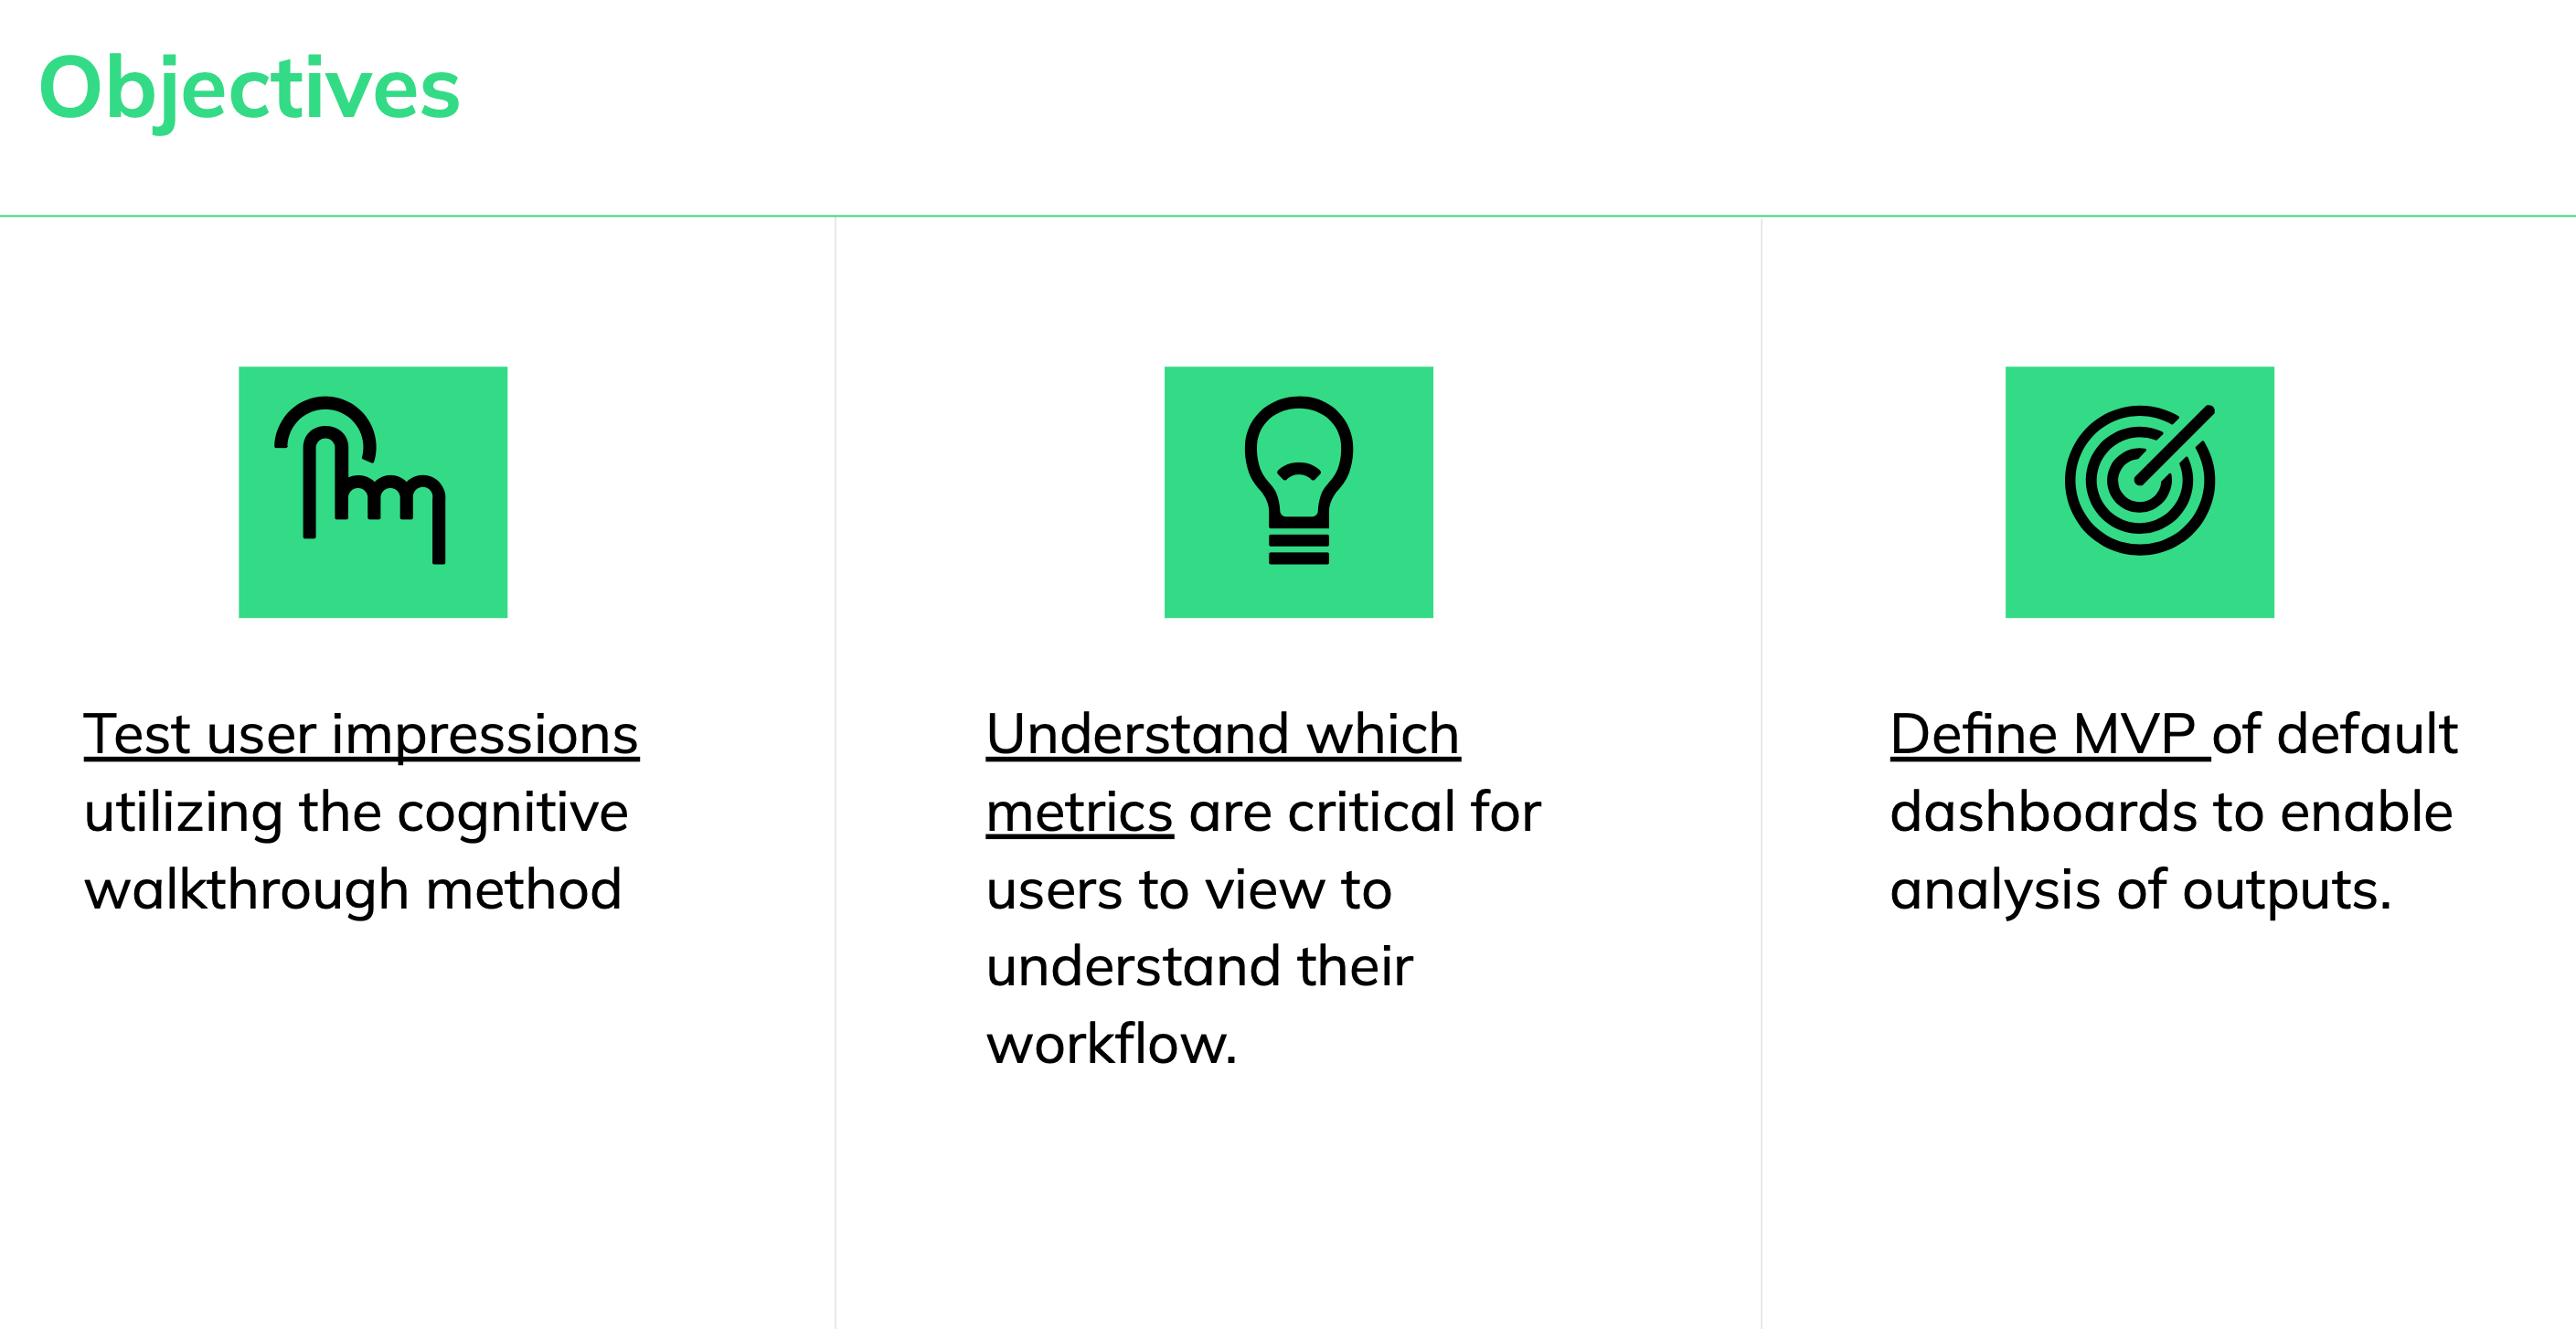
User Research Overview
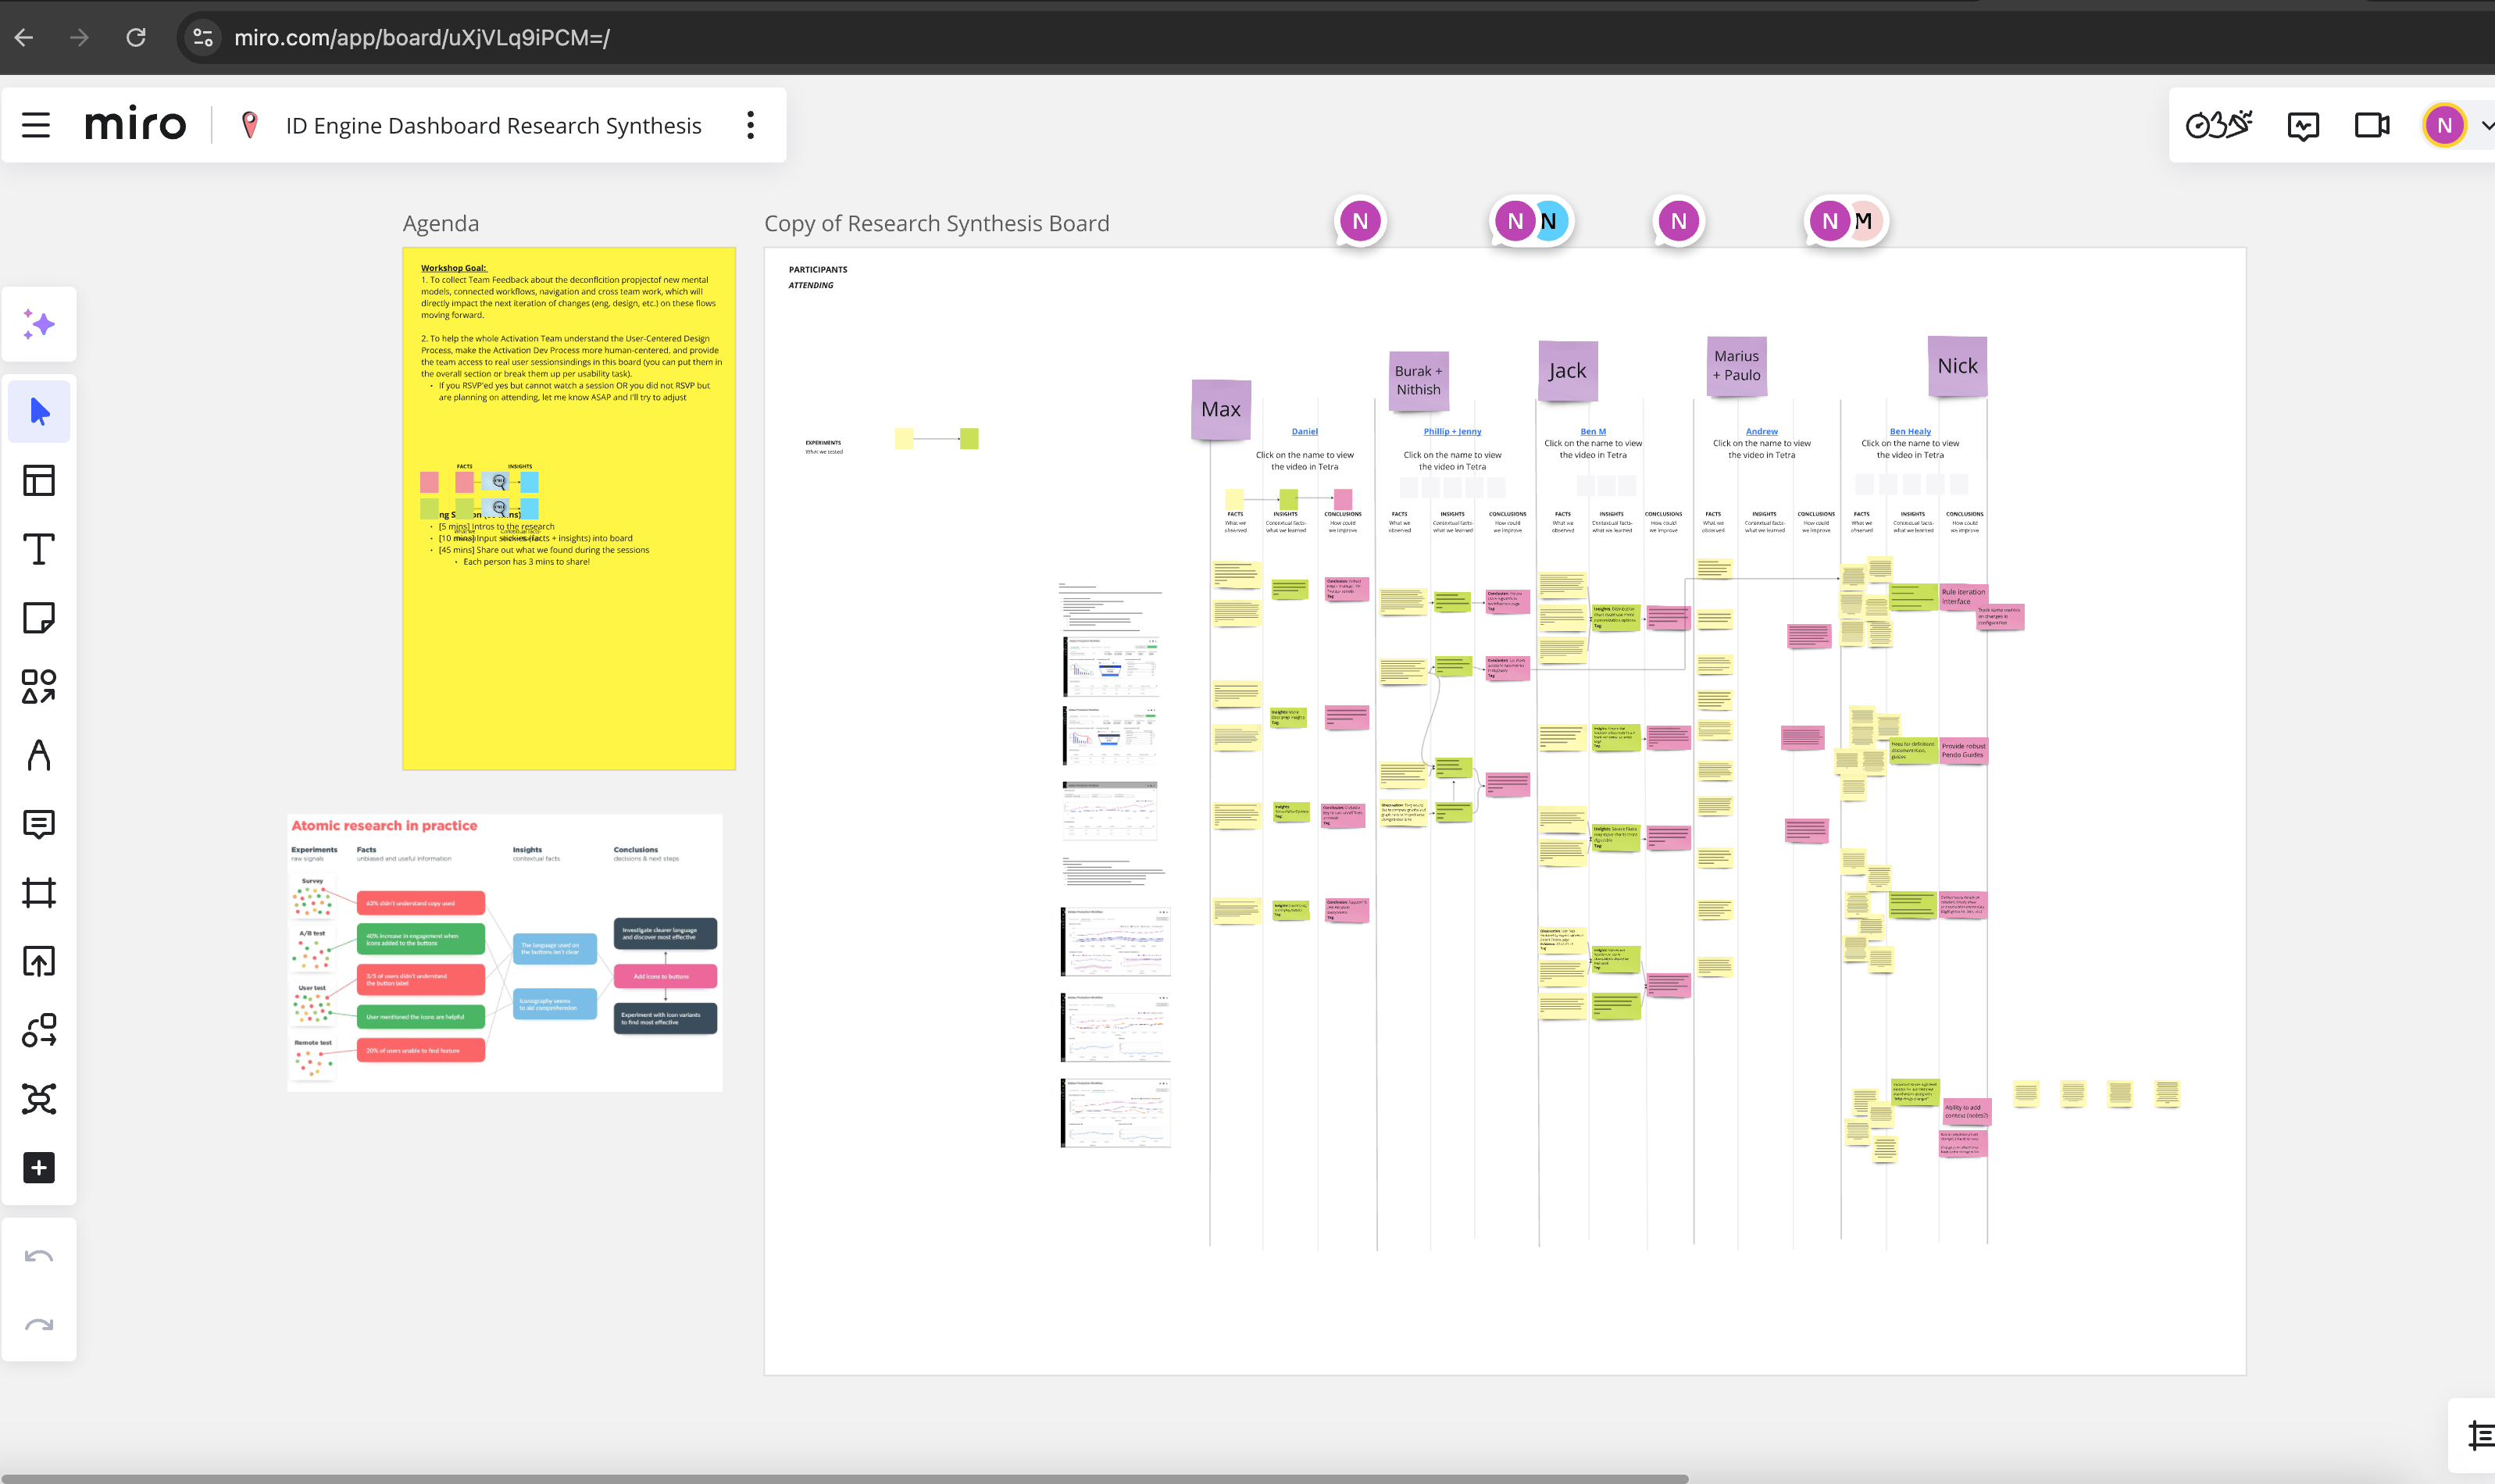
Ran Atomic Research Synthesis Workshop
Research Insights
Iteration and Alignment with Motif Design System
Design Delivery
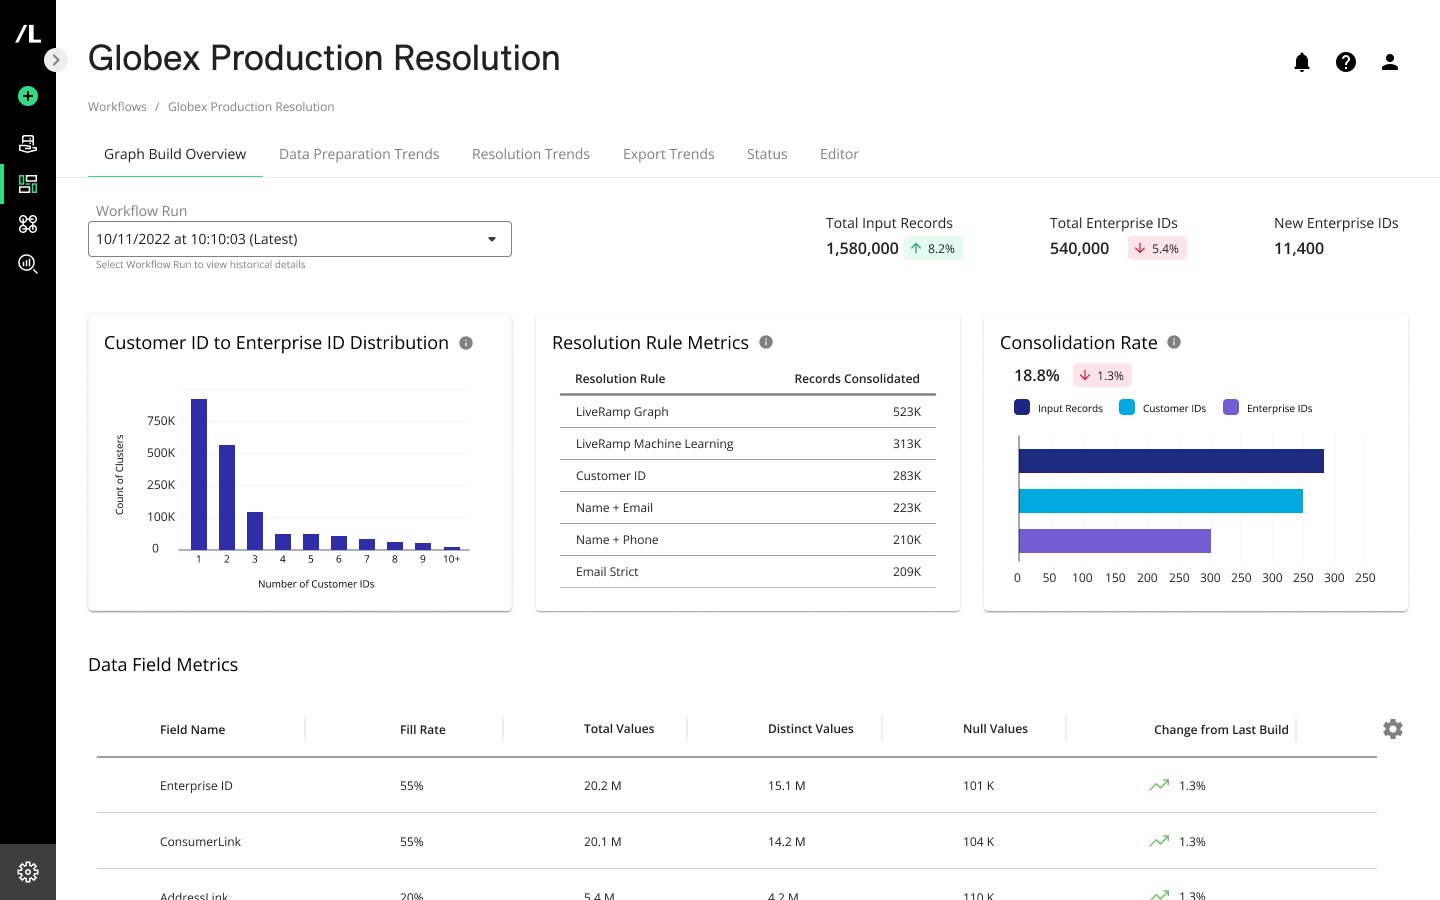

Results and Feedback

- Closed deal with $400B+ retailer
- Increased visibility and confidence for users
- 15% increase in self-service user engagement
“The ability to show those resolution rules and then the consolidation for each, I think is impactful to users, especially for stakeholders who maybe aren’t as familiar with identity.”
- Andrew Myles, Director Product Management, Environics Analytics

Challenge
- Using different research methods as a tool to build alignment across stakeholders
- Limiting scope will increase the speed of development and quickly provides incremental value to customers
- Customer feedback and value are limited with long ideation and development cycles
- As product changes, design representations must change at same pace

Learning